Part 1: Structure of the Reblogs
A cascade is the network of reblogs created as a post spreads from one user to another. The total note count for a post collapses all of that activity into a single number. For example, Martin & Bosco’s post has over 351,000 notes. The structure of the cascade matters because it determines which versions of a post get amplified, whose commentary gets read, and which branches remain alive on Tumblr. The reblog network directly shapes what you see on your dashboard.
How Does Martin & Bosco’s Post Compare to Other Cascades?
Martin & Bosco’s post has over 135,000 reblogs and has been actively shared since 2022. To put this level of activity into perspective, let’s look at some relevant literature:
In an analysis of a large Twitter dataset, only about 0.025% of cascades contained at least 100 shares (Goel et al., 2016).
In a large-scale study of Tumblr activity, only 6.8% of posts were original, meaning most were reblogs of existing content. Photo posts were the dominant content type, accounting for about 80% of all posts. The majority of posts in the dataset only reached small audiences, typically between 1 and 100 users. Very few posts reached large audiences: only a few dozen reached 10,000 users (Xu et al., 2014).
In a dataset of Tumblr’s most popular posts from 2014 (drawn from the “Year in Review”), only about 18% of cascades exceeded 100,000 reblogs (Alrajebah et al., 2017). Even within this curated set of high-performing posts, this level of reach was unusual.
In Xu et al. (2014), most original posts in their Tumblr dataset were short-lived: 90% remained active for less than two days, and only a small fraction (about 2–3%) persisted beyond 40 days.
Taken together, the literature shows that Martin & Bosco’s post falls into a rare category. It is large, long-lived, and continuously active, whereas most cascades quickly fade and reach relatively small audiences.
The Cascade Metric Series
This four-part blog series uses Martin & Bosco’s post to show how reblog cascades form, grow, and distribute attention across Tumblr. Each part focuses on a different force shaping that spread:
- Part 1: the overall structure of the network ❖
- Part 2: the impact of blaze as a platform intervention
- Part 3: how an individual user (Laura, the author) influences the spread
- Part 4: what we learned and the methodology.
In this first part, we focus on the overall structure of the network: how deep it goes, how wide it branches, and how activity is distributed throughout it.
Refer to Figure 1 (below) if you want a quick refresher on terms like reblog chain, reblog hop, parent, child, and branch while reading the cascade metrics. Tumblr users will likely recognize these patterns from their daily use of the platform.
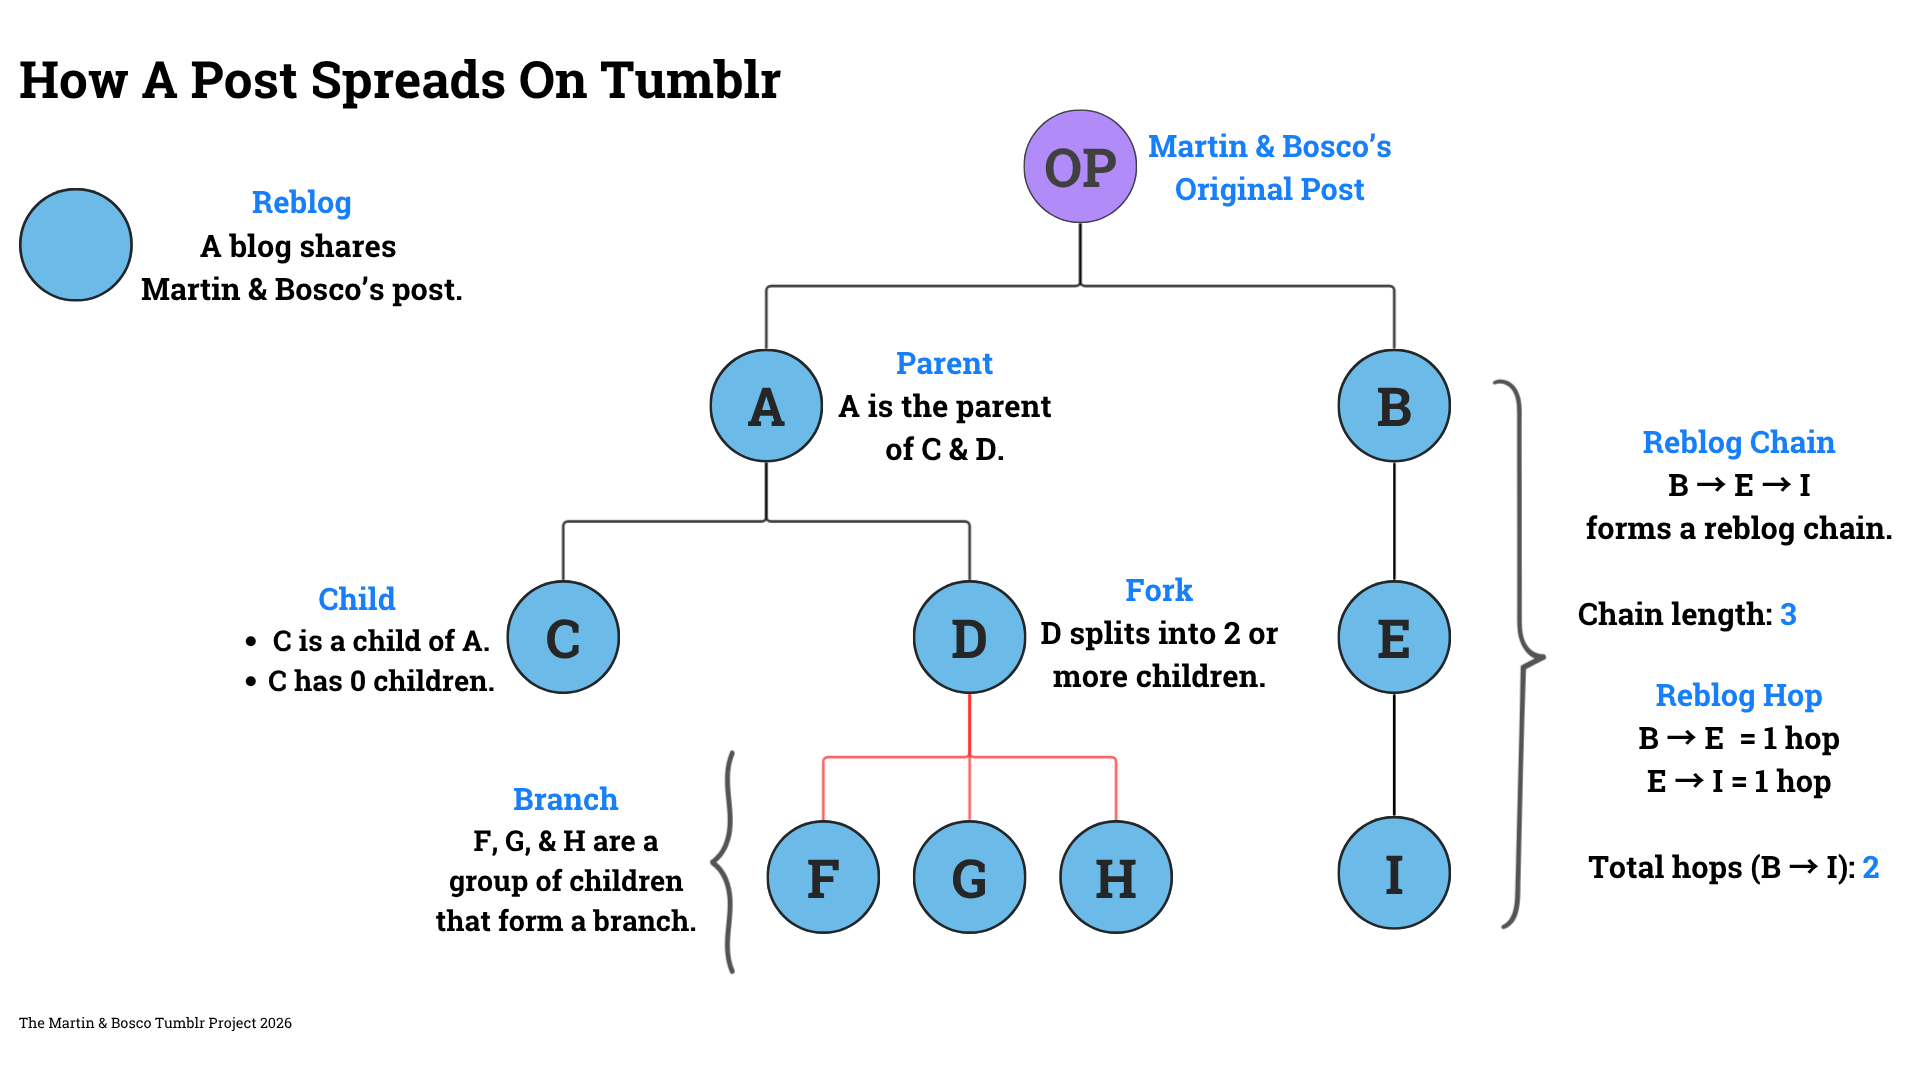
Figure 1: Network diagram showing how a Tumblr post spreads through reblogs. It introduces key terms used on this page.
- Median reblog chain length: 3
- Longest reblog chain: 38
- Median number of children per reblog: 0
- Reblogs without any children: 92,909 (68.7%)
- Reblogs with at least one child: 42,386 (31.3%)
- High-branching reblogs: 1,058 (0.78%)
- Children from high-branching reblogs: 31,726 (30.0%)
Most reblogs of Martin & Bosco’s post don’t get reblogged again. Deep chains and reblogs with many children are rare. So, how did the reblog network grow to be so large? A substantial minority, about a third of reblogs, generate at least one additional reblog. That repeated sharing adds up over time.
Data Statement
- Data updated: Feb. 02, 2026
- Total posts (including the original post): 135,296
-
Data were collected using Tumblr’s public
/postsAPI endpoint, and no access-circumvention methods were used. Aggregated metrics were calculated from reblogs successfully returned by the API. Updated annually.
A Closer Look
Let’s look at two plots to help visualize the meaning behind some of the cascade metrics.
-
The blue histogram (Figure 2) shows the distribution of reblog chain lengths across the dataset. Chain length is measured in reblog hops by following each reblog’s parent until the chain can no longer be traced. Most chains are very short, which is why the median is 3. The long tail on the right shows the rarer cases where activity continues much further, including the maximum length of 38. Those far-right bars are tiny because only a handful of chains reach those depths.
-
The orange bar chart (Figure 3) helps put the 0.78% value in context. High-branching reblogs, defined as reblogs with ten or more children, are rare. Despite their rarity, 30% of reblogs in the cascade are children of these high-branching posts. New high-branching reblogs are formed every year. These hubs create bursts of activity that help keep the network growing.
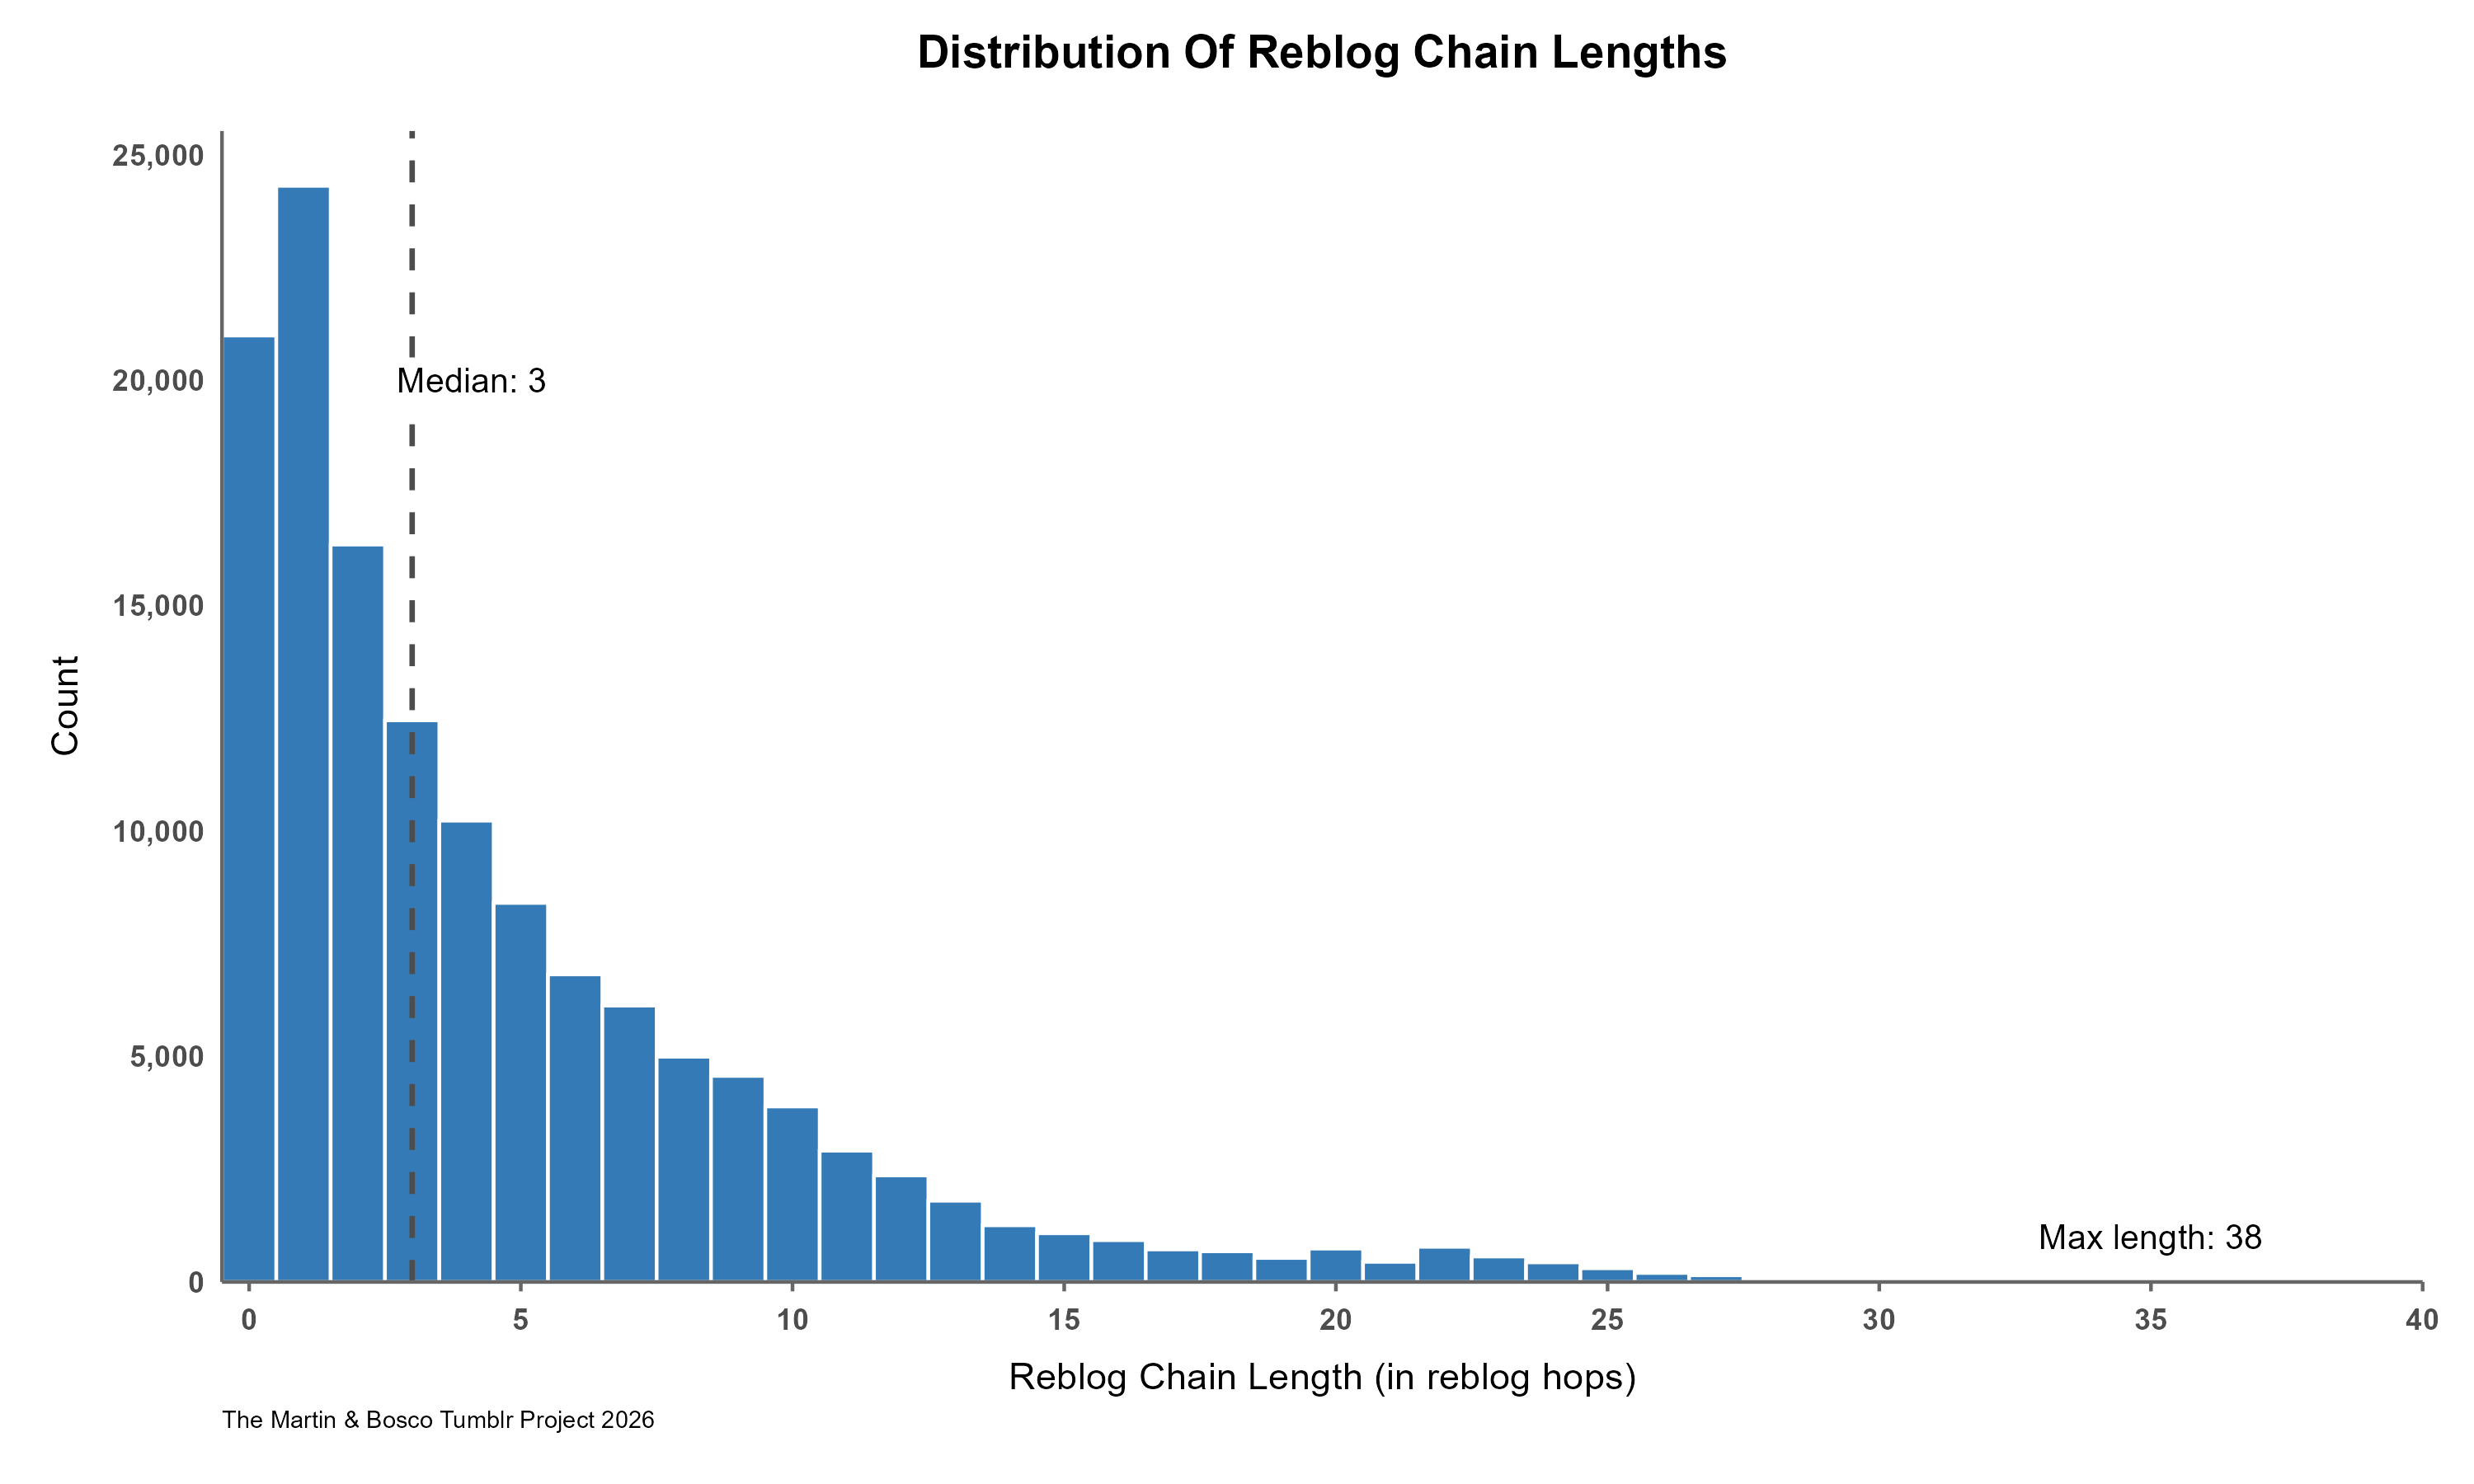
Figure 2: The plot shows the distribution of reblog chain lengths, measured in reblog hops. Most are short, but there is a long tail of rarer deep chains. The dashed line marks the median.
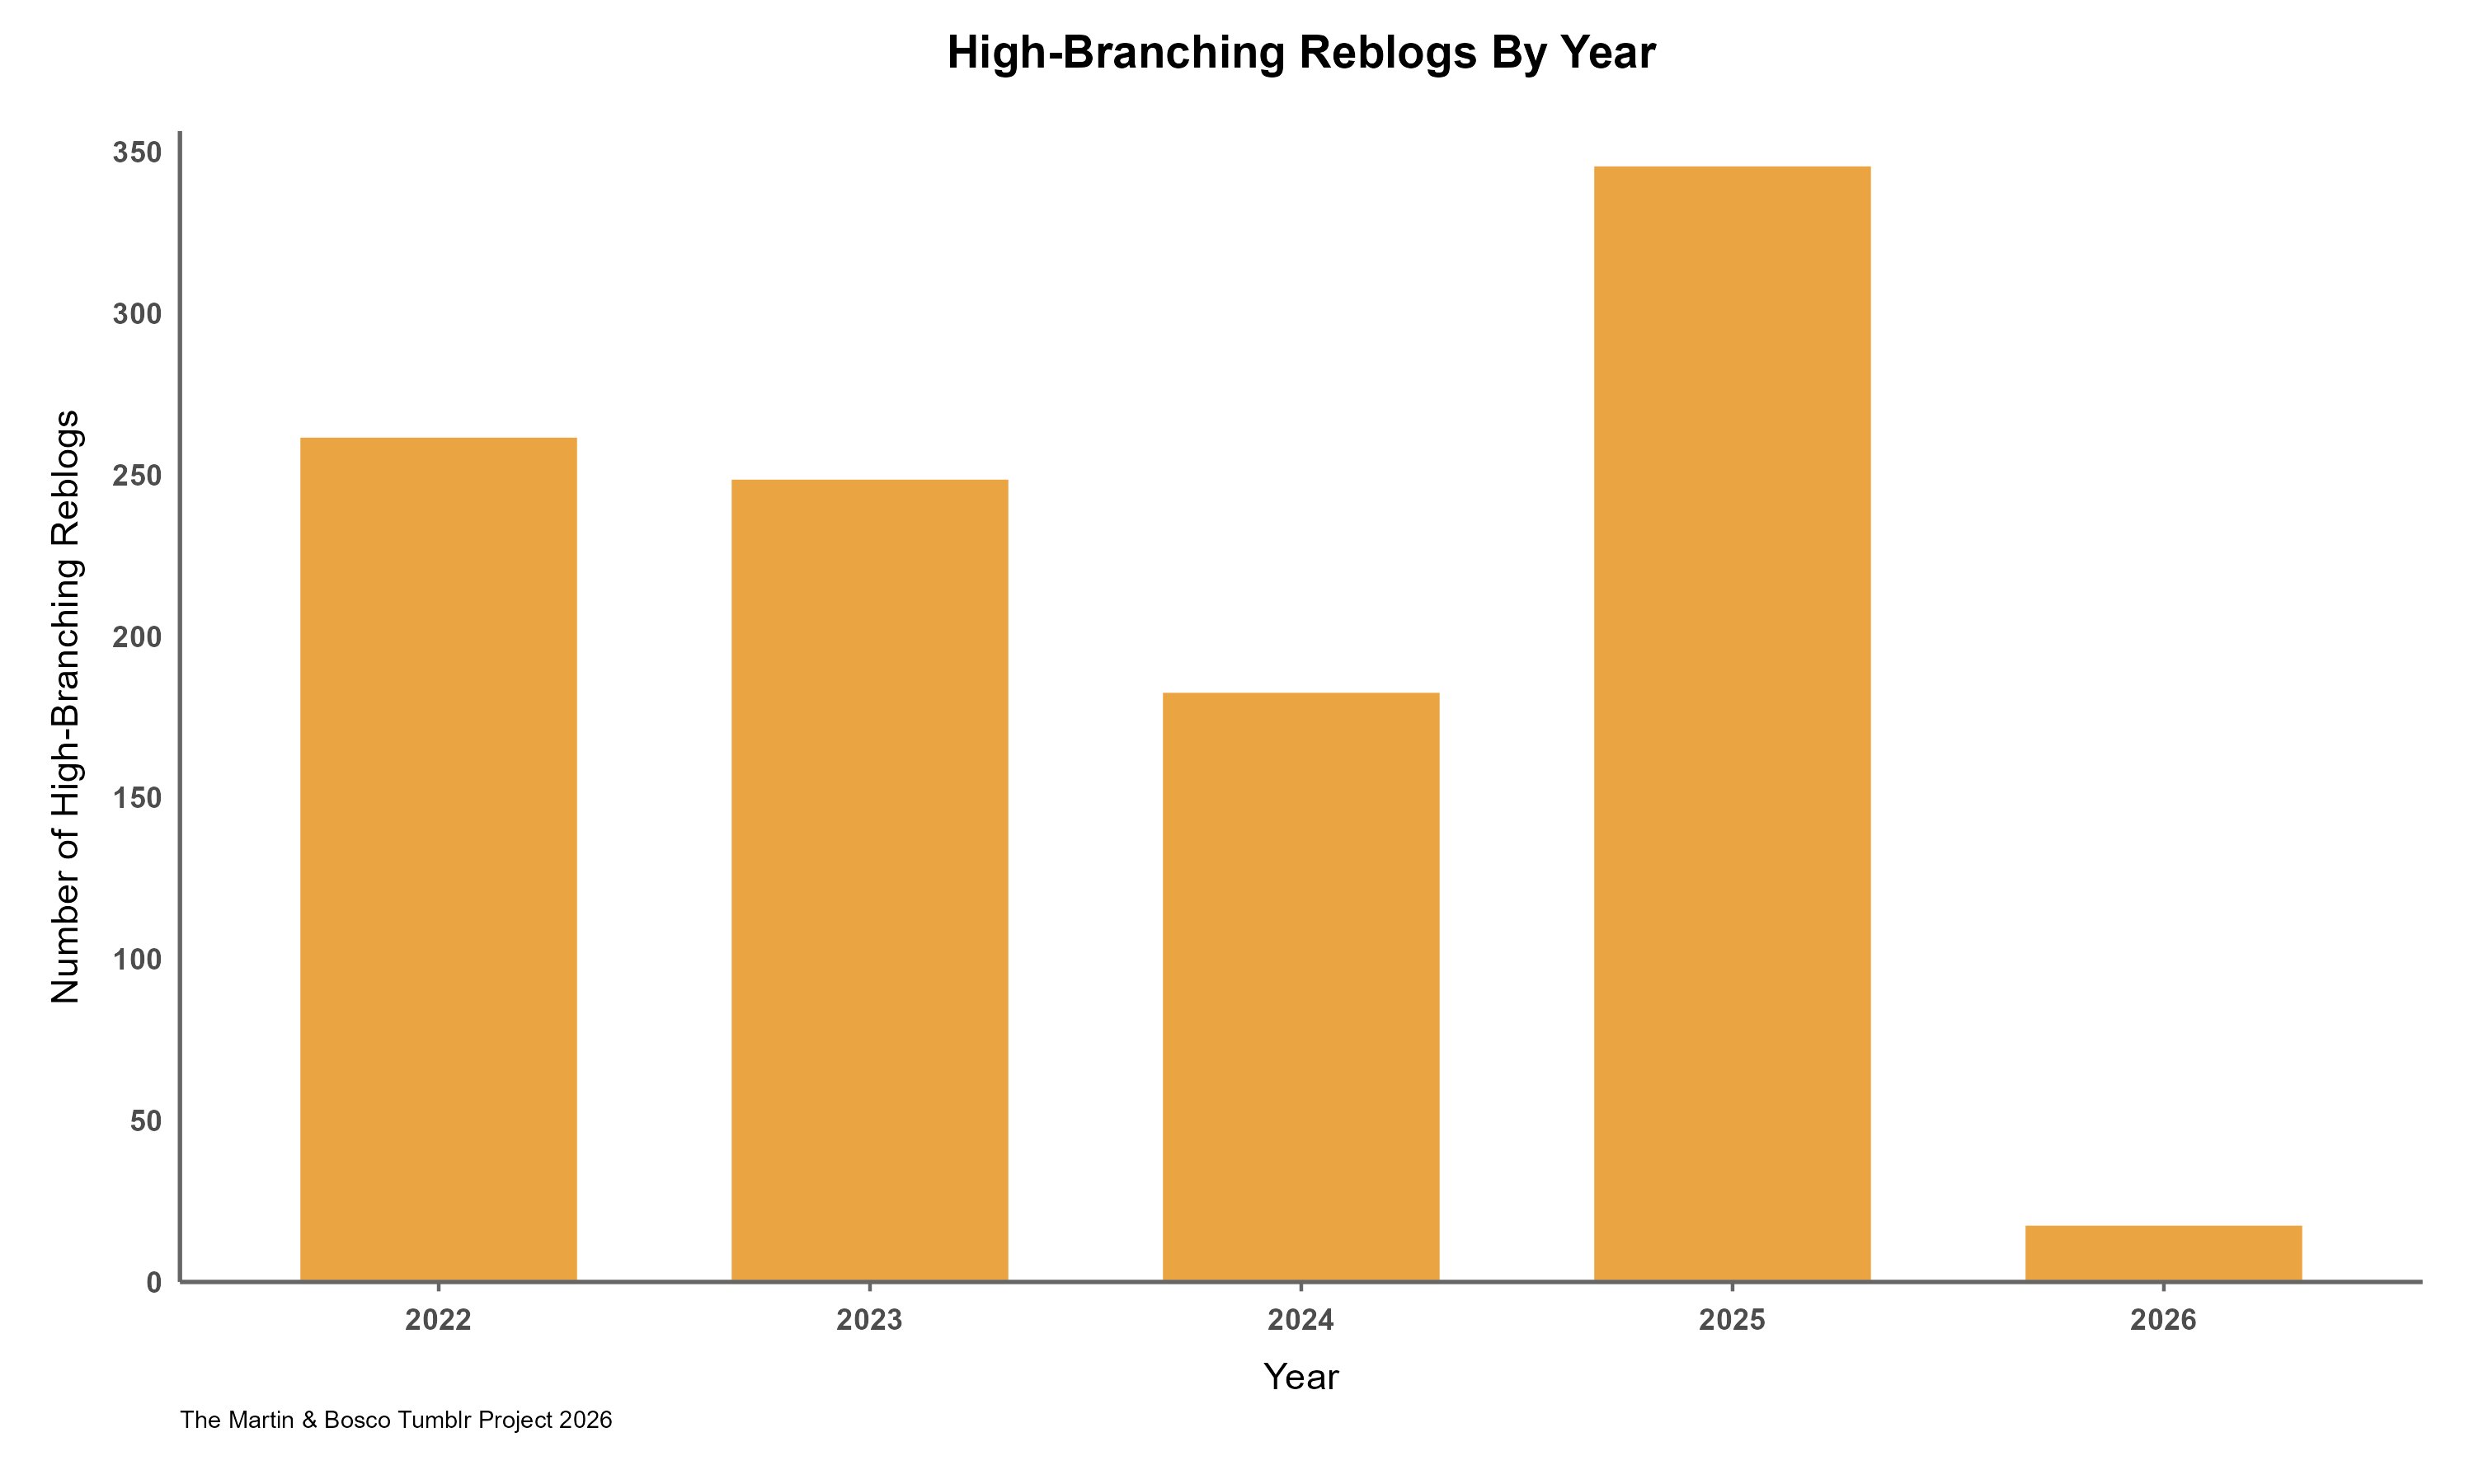
Figure 3: The plot shows when high-branching reblogs occur across the dataset by year. High-branching reblogs are reblogs with ten or more children. The 2026 bar only includes data up to February 2.
Test Your Knowledge
Question: From the blue histogram shown above in Figure 2, how long is the typical reblog chain?
Answer
As shown by the dashed line in Figure 2, the typical reblog chain is 3 reblog hops. It can be shown as:
A ➔ B ➔ C ➔ D
Here A, B, C, and D represent four reblogs in sequence, corresponding to three reblog hops. Most reblog chains in Martin & Bosco’s post stop around this length, though a few travel much farther. The simple A ➔ D example shows a complete chain, but in practice, only the portion that can be observed is measured.
► Remember the median value because we will see it again in the next blog post.
Stay Tuned
In the next blog post, we’ll explore how blaze promotion affects which reblogs get seen and shared again, and how that shapes the spread of Martin & Bosco’s post.